When Async Attacks!
If you're saying, can I now hear you? The answer is still no. But I'm just putting words in your mouth. So if you're now laughing in frustration about Linux audio, then we are all sympathetic but cannot hear you.
Bryan Cantrill:Is that directed to me?
Adam Leventhal:No. No. This is Eliza's hilarious audio problems, not your hilarious audio problems. Know,
Bryan Cantrill:I should have known that. I should have known that I've actually I have actually plenty of time. Like, I actually only outrun the bear here.
Adam Leventhal:Is it Mel Brooks who's like, tragedy is when I cut my finger. Comedy is when you fall down an open manhole and die. I feel like there's something very similar to that with regard to audio issues.
Bryan Cantrill:Linux audio? Yeah.
Adam Leventhal:Like when it's happening to someone else, it's hilarious.
Bryan Cantrill:It is hilarious. You know what I would also like in it too is like and I don't if you're the same way, Adam. I am at ease. When I am on a flight and a infant or toddler is losing its mind, it calms me. It literally calms me.
Adam Leventhal:It's so it's so true. There is I think for every parent, right, like before you have kids, when there's a screaming toddler or screaming child on the flight, you're like,
Bryan Cantrill:oh, brother. Get out of here. Situation. Totally. Yeah.
Bryan Cantrill:Yeah. Exactly.
Adam Leventhal:When you have had when you've had responsibility for a screaming child on a flight, and then then you go on a flight and it's not yours. You're like, that's fine. Like, scream all you want, kid.
Bryan Cantrill:Like, I don't Just scream all you And in fact, it actually makes me feel better because I feel no. I mean, legitimately, I feel that there's a karmic cadet that I incurred with my own creepy toddler. I'm I'm sure you had this happen. You know, my now my now 20 year old when when he was nine months old screamed the entire flight from Chicago to San Francisco. And then we we finally get into, like, final approach.
Bryan Cantrill:We we've been cleared to land. We're over to the San Mateo Bridge, and the kid just falls asleep.
Bryan Cantrill:Are you kidding me?
Bryan Cantrill:Yeah. Joking.
Adam Leventhal:You younger one was never much of a screamer, but you will enjoy this. On a flight to Amsterdam, like, he he actually, he would scream if you stopped moving. So on a flight to Amsterdam with him, I walked something like a mile just doing circuits on the airplane.
Bryan Cantrill:I and would you you also see like, you see that too when you're traveling. You see some parent. Oh, could I assume, like, a year and a half old, something like that? Was that the age?
Adam Leventhal:He was he was, like,
Bryan Cantrill:11 or something like Yeah. Yeah. Right. We we know, like, he's like, he needs that mobility to just for his own sanity. And you just see, like, a parent just doing laps on the plane.
Bryan Cantrill:And you just again, it it just like it it it it's it's He made so friends
Adam Leventhal:on that flight because, you know, everyone saw him 35 times, including one person who was like, can I feed him a peanut? And I'm like, this is not a petting zoo. Right? This is not like, there are many reasons why the answer is no. But it's not like we do.
Adam Leventhal:At that age, the answer was no. At at at
Bryan Cantrill:You are no on foreign peanuts?
Adam Leventhal:Think You don't have to worry about I think point is think E a variety of reasons, peanuts are a no before one, I guess. Maybe not.
Bryan Cantrill:I think you also asked Paul question like, do you have children? Because if you have if they have children, then you can be assured that it's not a poisoned peanut. If they do not have children, the peanut might be poisoned, actually. I don't
Adam Leventhal:I wasn't that worried about a poisoned peanut other than, like, you know, he had never had a peanut before. So other than the, like, intrinsic poisoning qualities of peanuts.
Bryan Cantrill:What better time to experiment with peanut allergies than
Adam Leventhal:Than over the Atlantic?
Bryan Cantrill:Yeah. We we knew that that there's gotta be an EpiPen on here somewhere. Right? Well, there's not there should be. I think we can all agree with that.
Bryan Cantrill:There should be.
Adam Leventhal:Yeah. And for sure.
Eliza Weisman:Start testing in production.
Bryan Cantrill:There we go. There we go.
Eliza Weisman:To assume that you can hear me, but it sounds bad?
Adam Leventhal:Yeah. We you sound Adam's a critic.
Bryan Cantrill:I think it sounds fine. But yes. You should I think it sounds fine.
Eliza Weisman:Okay. Well, the fancy USB mic has refused to talk to Pipewire for obscure reasons, so we're stuck with this.
Adam Leventhal:In that case, you sound more than adequate.
Eliza Weisman:I would just like to point out that during the last iteration of the debugging call that we were we're we're about to discuss, my mic didn't work at all.
Bryan Cantrill:Yeah. No. There is there's definitely something to that, a kind of a a karmic balance that must be achieved that that we can have functional systems or functional audio, but actually not both of those to actually And
Dave Pacheco:I don't know if this is a spoiler, but don't forget that Meet failed. Google Meet had an outage in the middle of all the MeetMe too had an outage.
Bryan Cantrill:Yeah. That is which which is not I mean, that's a kind of a first I feel like that was that was very surprising. But yeah, that was I it was definitely an adventure. And maybe that's a that's a good segue Dave into kinda how I kinda wanna tell the story of of how we got here. And Augustus, it really starts with you and you noticing.
Bryan Cantrill:So we for those folks who've been following the company, you may be aware of this, but for those who are not, we have our own oxide rack that is in production. We've got an oxide rack that we use that is in like development. We affectionately call dog food that is like constant that looks like a dog's breakfast actually at this point. It's really not. We used to show that off to to like potential customers come by the the ops, Adam.
Bryan Cantrill:And now it's like, I don't know. It's like, if you're like, is there a Dell Optiplex in there? I'm like, there is, but that's I mean, let's not look at that. For a $100 on eBay, right? You're focusing on the wrong thing here.
Bryan Cantrill:This is but the so we've got our own kind of engineering system, but we also taken a a production oxide rack. I mean, and actually, technically not the very close to production PVT build. And we stood that up ourselves in an actual proper data center, not in our our office here in Emeryville. And then we use that for people to it's a great way for people to try the oxide rack, which is terrific. We can spend up a silo for them, and then we use it ourselves for our own infrastructure.
Bryan Cantrill:And adamdtrace.org, if you go to if you go to the the the my blog anyway. Is your blog on the oxide rack yet? Are you am I this Why
Adam Leventhal:are we doing this? This
Bryan Cantrill:I did you know, I I realized this came across as pointed and I really didn't intend it that way. Let's just say that some blogs are on the oxide rack and some others have made different choices. Yeah. Yeah.
Adam Leventhal:Don't worry. I'm editing all this out anyway. There you go.
Bryan Cantrill:No. But the so we and we use it for our own infrastructure and it's a lot of fun to be our own customer. So, Augustus, you are you noticed in what we call colo that it was not performing very well. You were you were going to see something you'd seen what felt like a regression in performance.
Augustus Mayo:Yeah. We had just formed an update to our latest release candidate. So we're worried, you know, alright. Did we introduce something new that's causing latency on certain requests? And I got pinged by multiple people.
Augustus Mayo:So there's multiple people across the company started to notice it. So it was definitely a, let's start looking at this immediately type of thing.
Bryan Cantrill:Right. And and what did you start to discover?
Augustus Mayo:So we had a couple things going on. Post the update, we had been running some disk removals. So that's a background process that ended up causing, like, a decent amount of database strain.
Bryan Cantrill:It actually is it worth just explaining Yeah. Little of go tangent on tangent about why we were doing that, actually. It's kind of interesting. Yeah.
Augustus Mayo:Yeah. So we're going to compliance, more compliance. Compliance testing takes we need real running hardware that's all, like, fully functional working. So we're testing sled removal to move those over to a compliance rack.
Bryan Cantrill:So we're required compliance is for, like, electromagnetic interference. We and ring that favorite chime of ours when we point you to the the oxide in the chamber of mysteries where we did our initial compliance run, but we are now making the oxide rack available for sale in other countries. And that requires there are different regulatory regimes in Europe and Japan, for example. So we need to do another compliance run.
Bryan Cantrill:So that's the So,
Augustus Mayo:Right. So we take these we remove one sled at
Augustus Mayo:a time just so we
Augustus Mayo:can make sure, you know, that things look healthy. So remove a sled. It triggers a whole bunch of tasks, which so that all runs automatically when the sled gets expunged. We thought, are we calling too much database contention based on the load coming from replacing disks? But so we take a look at our logs from there.
Augustus Mayo:We see some errors around database access. So these sagas that run-in the background, the repair disks are starting to fail to get database claims. And that's probably where our journey starts. We start looking at, yeah, why can't we talk to the database? And I I think this all eventually stems from that.
Bryan Cantrill:And, I guess, at what point are you like, there's something amiss here? Or maybe maybe you're already past the point where like, this is not something is not right. We need to be investigating this.
Augustus Mayo:Yeah. So the first thing, as as soon as we start seeing latency, we know, like, that's never good. That's always, a major indicator. Seeing a the logs say that they cannot acquire a claim to the database or essentially a handle to the database is always going to be bad. Means multiple types of systems are failing.
Augustus Mayo:The system is resilient to that. It can keep moving along, but we need to know what introduced the condition that made that occur. We spent a bunch of time looking through our database. So obvious things are all of the database copies running? Does Nexus have connections to all of the databases?
Augustus Mayo:Are they running out of CPU or memory? Our initial looks though, none of those all looked fine. All nodes were up, all of our control plane had the expected number of connections to all the database nodes. We weren't running high on CPU or memory, which puts us in a really interesting case of, well, if the database is fine, then
Augustus Mayo:why can't we talk to it?
Bryan Cantrill:Right. If everything is fine, why does the system suck?
Adam Leventhal:And just just a couple of definitions. We got Nexus, which is our kind of orchestration software running the control plane. And then when we're talking about the database, we've got CockroachDB. And how many shards do we have? Is it is it five?
Adam Leventhal:Or how many copies? Yeah.
Dave Pacheco:Yeah. It's a five node cluster with replication factor set to five. So everything goes to all five.
Bryan Cantrill:Sweet. And so, I mean, a reasonable thing to check is, like, how is the database behaving? I mean, it's we're we're we're kind of beginning to back up. We we are complaining about not giving up yet a database handle. And the first thing you wanna be sure of is is the database functional and is it operating at a latency at what we expect?
Augustus Mayo:Yeah. And that seems like the most obvious answer. So Yeah.
Bryan Cantrill:And we but that but that seems fine. Alright. The database seems And how are you actually Augustus, how are you determining what the database's response responsiveness is?
Augustus Mayo:So it's mostly like your standard debugging tool. Like, just going into the actual database. So we'll, you know, connect to one of the Gimlet hosts, go into one of the cockroach zones, and see how many connections do we actually have outstanding to this thing. We can also look within those zones and those slides to see if those are running, if the memory or CPU is particularly high on those. And then we also verify that we can reach all five nodes from each of the Nexus control plane zones to make sure, like, we haven't lost network connectivity for some reason throughout there.
Bryan Cantrill:And, Dave, when did you swing in on this? Is it, like, it's kind of about when you were swinging on on this problem?
Dave Pacheco:I, you know, I swung in early because the first problem we we first noticed this when we did the expungement because we were having all these saga failures because of this claim error. And we were getting a whole bunch of other scary stuff from steno that is mostly unrelated, but I spent a while digging into that. And then it seemed like that was fine. So I kind of stepped out a little bit and came back in, I don't know, twenty minutes later when we started digging into the console latency problem, which is, I think, really what we're talking about. And there were I don't know how much you want to dig into all the blind alleys we went into as well.
Dave Pacheco:I mean, there were several even at this phase. You know, a lot of them pretty short. But, like, we had a change in this release to the way that we stored session tokens, like the table that stores session tokens. And so there was a point early on where we were like, and it had affected the schema migration because we found that the table was really large in this particular deployment. And so one of the first things I thought was, is did we screw up the indexes on this somehow?
Dave Pacheco:And these queries are taking forever, and they're occupying all the database connections. And that was very quickly not the case. But, you know, there were a bunch of stuff like that that came up early.
Bryan Cantrill:Then okay. So in
Dave Pacheco:Go ahead.
Bryan Cantrill:Okay. So what's next? At some point, we exonerated the the the database by looking from the Diesel side and actually looking at our query times.
Dave Pacheco:That's right. And I don't remember the exact ordering of things, but I think it was relatively early that we went and looked at. We have so one of the things we did relatively early with the database integration I think this was work that Sean did was add DTrace probes to actually, sorry, maybe this was Ben. The points where we are executing queries. So we're using Diesel to execute a query to the database, and we have start and done, and we have the actual SQL as well as the the SQL bind parameters so we can see what's going on.
Dave Pacheco:And that was able to that showed that there wasn't anything that egregious. So the the way I would characterize the problem at this point was that if you, like, refresh the console page, which makes a whole bunch of HTTP requests to fetch all the files and stuff like that, Many of those requests would complete very quickly, and then you would hit some requests that were taking, like, eight or nine seconds. And so you'd be sitting there watching it, like, not complete, and then all of a sudden, like, a bunch of those end up completing. So, yeah, that was what it looked like. And then we weren't seeing any database queries taking anywhere near that long.
Dave Pacheco:I think the longest we were seeing was in the five hundred milliseconds to one second bucket, which is it's a little hard to see how that turns into an eight or nine second HTTP request.
Bryan Cantrill:And we we were seeing very few of those. I mean, as I recall, it's like we were really not seeing when I was looking at it, it was like, you know, outliers at maybe hundreds of milliseconds.
Dave Pacheco:That's right. It was like one out of thousands that we had that we traced. And that included that whole period where several requests had taken a long time.
Bryan Cantrill:And this is just a a quick aside on this because I think this ends up being very load bearing for the stuff that we ended up doing later on this problem. So you you mentioned the the Ross USDT crate, which I believe we also talked about Adam in our d trace at 20 episode. But this is the work, if not other ups. I feel like we must have talked about that a couple of times. But this is, I mean, work that has been just absolutely essential for us.
Bryan Cantrill:Do you wanna just describe that a little bit? Because what you were using, Dave, you were using the the the USCT probes that we had built into the system that allowed us to really like, we wanna know how long our query's taking in terms of, like, a query. And those probes were really critical for exonerating that part of the system.
Adam Leventhal:Yeah. In terms of the USDT provider or probes in in Rust, that was something Ben Necker and I did, like, four years ago or something like that, certainly, like, shortly after he arrived at at Oxide. And I think not to give the whole history of USDT, which we've done several times and at length, but I would just say that, like, each time we have brought USDT to a new language or area, we've gained even more religion about the utility of it. So, you know, we made it so that it was pretty easy to drop in probes so that, it would be compiled into your Rust program. And then after the fact, on a DTrace enabled system, you could dynamically instrument them and see what was going on.
Adam Leventhal:And I think the one weird thing or particularly weird thing that we did with Rust was we used is enabled in SerDY to and then JSON processing within the kernels, you know, Dtrace capabilities to be able to transmit complex types from your userland process and Rust into the kernel. And it's sort of awful, but sort of elegant at the same time.
Bryan Cantrill:Yeah. You're obviously you're you're you're fishing for the obvious thing. Well, it's glorious. Come on. It's glorious.
Bryan Cantrill:It's not awful. It's glorious.
Adam Leventhal:Well, it it's it's got surprising effects. Like, if you don't tune your string size appropriately, the JSON implementation of the kernel is is sort of permissive. And it's like, well, I never saw a closing brace, but I'm I don't know. I did my best. It's like, well, your best wasn't good enough because you didn't find the things that I was interested in and there was no error message.
Adam Leventhal:So there there are, like, corner cases like that. But by
Bryan Cantrill:and large, it's great. As a great man once said, we view the oasis as half full.
Adam Leventhal:That's true. What a legend.
Bryan Cantrill:What what a legend. Whoever said that that was the line that Adam what were we talking about when you we we there was someone who was We
Adam Leventhal:were talking about the CPU performance counter probes in the trick that someone was adding. And I think, you know, CPU performance counterprobes were pretty awkward in terms of how they wedged their way into DTrace. And I think someone was, like, observing some of the deficiencies. And, yeah, we we do view the Oasis as half full.
Bryan Cantrill:That was your observation. It was very
Adam Leventhal:very astute. Kinda ended the conversation.
Bryan Cantrill:It did end the conversation. It's like, okay. Well, you're obviously not interested in my feedback on the on the way that the oasis could be improved. It's like, do you want the oasis or do not want the oasis? Look, next food gas, 110 miles.
Bryan Cantrill:You can keep walking. Right. So okay. But this has been really important. And so Dave, you were using this to be able to and using the the DieselD Trace.
Bryan Cantrill:I I because that's like is that a is that a crate or an option in Diesel? Have we or have we done that in now you've dropped a link to the actual the actual repo.
Dave Pacheco:I need to double check. I think it is it's definitely not just an option. I think we we created a crate that I think imples the diesel connection trait.
Eliza Weisman:Got it. Okay.
Dave Pacheco:Yeah. Then we and it wraps some other connection trait imple. So you can use it to basically wrap any other kind of connection, and it will just instrument that one.
Adam Leventhal:I think it's basically kind of like an interposer. Is that right, Dave? I I think I've I've been in that code in the past, but
Dave Pacheco:Yeah.
Adam Leventhal:Think six
Bryan Cantrill:yeah. And so based on that, it's like, this does not seem to be a database.
Dave Pacheco:Yeah. That's that's
Bryan Cantrill:What was next? What was Augustus, I'm trying to think what was I think we were
Augustus Mayo:just Yeah.
Bryan Cantrill:A it felt like a lot of time kind of wandering around. We were not able to figure out what was going on.
Adam Leventhal:So we were fairly confused at this point, but we did know that we had we could at least look at an individual request and figure out which control plane endpoint, what Nexus instance was handling that.
Augustus Mayo:So our next clue was, what is Nexus telling us in the logs? Where are we spending our time? That's where we got to the first mystery of so we have a log entry that occurs when any endpoint finishes result or whenever a handler finishes running,
Adam Leventhal:and it admits how long that handler took. So we clearly saw handlers taking eight point nine, nine point two seconds.
Augustus Mayo:But when you look at the actual logs that were emitted during the handler, the time between the first log and
Adam Leventhal:the last one is one hundred, one hundred and fifty milliseconds.
Augustus Mayo:And so we have essentially eight or nine seconds of unaccounted time.
Bryan Cantrill:Unaccounted time. Right.
Augustus Mayo:We don't know where it came from.
Dave Pacheco:And importantly, it's all at the beginning of that request. That actually told us that those two data points told us kind of a lot. Right? Because you can definitely see problems like this if there's a client problem where it thinks it's made a request, but it hasn't, or it's gotten stuck in TCP hell somewhere, and the server just doesn't get it for nine seconds. That wasn't happening because we were reporting on the server that it was taking nine seconds.
Dave Pacheco:And then the fact that it was all in the last one hundred and twenty milliseconds meant that including, for example, the OZ stuff, that was all happening at the end meant that it wasn't like we went off and did some database query as part of whatever this request normally does, and that was taking forever. It was like something was happening in some unfortunately invisible part before all of that.
Adam Leventhal:So request comes in, and and nothing happens for kind of an awkwardly long amount of time. And then we do our first thing, which is to validate credentials. Is that right?
Dave Pacheco:Yeah. That's right. Think I can't remember if authen if authen authen probably was that. Yeah. I think that's right.
Dave Pacheco:I think that what you just said is exactly right.
Adam Leventhal:Gotcha.
Bryan Cantrill:So pretty frustrating to put it mildly. And then so, Dave, and we at some point, we're we are definitely wondering about that there's because there are parts of the system we just can't see into. And one of the parts that we had we had some visibility, but not total visibility into was corp. Do you wanna describe that a little bit and kind of our our as the thinking was evolving about where this could be happening?
Dave Pacheco:Yeah. So a little bit about CORB. So CORB is a connection pooling and service discovery crate that we built. It's inspired by something we did at or some of us worked on at Joint called Qball. And it's all about doing the service discovery and connection management for high availability and scalability, you know, within the data center.
Dave Pacheco:So this is not like external service discovery and load balancing. But this is something that we have started using in a bunch of components and will probably use start using in all of our components is a way of it takes things like the DNS requests to do the service discovery and the connection establishment out of the request hot path by doing those things in the background asynchronously. And then you ask for a connection, and then you just get one. And it's a standard connection pool in a lot of ways. It's just doing a lot of that stuff asynchronously outside of the request path.
Dave Pacheco:And the error message that we actually got here that we saw this at the beginning was failed to access DB connection. Back ends exist and appear online, but all claims are used. And so that was why, you know, naturally, when certainly, when I've seen this kind of problem in the past, it's the database that's the problem. Because if the database does get slow, that's what you see. You see all these things backing up on this very limited resource, which is the number of connections available to it.
Dave Pacheco:And I guess you could kind of go back further and say that, like, when working with traditional relational databases, connection management is really important. They're an expensive resource on the server and they're very finite. And a lot of traditional databases like Postgres don't deal very well with overload, and so you need to not overload them by not having that many by not asking it to do very many things at once, which is part of this connection management stuff. And so that's why we have this limit. But now that we have now that we're hitting it, we're like, Okay, what does this mean?
Dave Pacheco:Especially once we've exonerated the database, that kind of led us naturally towards CORB because well, it certainly started leading to questions that we wanted to ask CORB. Like, well, okay. If the database is is completing these queries quickly, but claims are not available for clients to use, what's going on with those? Like the specific questions that we wanted to be able to answer eventually, I don't know that we quite formulated these right away, were like, how long are things holding these claims for? How long is it taking them to acquire these claims?
Dave Pacheco:And sorry. I forgot. I forgot what the last thing is I was thinking of.
Bryan Cantrill:And we were able to get to some of this stuff, but not all of it. We were kinda missing some of the I mean, we the it's not this was not without instrumentation by any means, but we we we didn't have quite a complete enough picture to fully exonerate CORE.
Dave Pacheco:Yeah. That's right. And the third thing I realized was it's how many connections were available at any given time. Because the assumption Right. You're in a situation where the database is the problem, then what you would expect to have is that all of the connections are in use all of the time.
Dave Pacheco:Right? But we were because the database wasn't the problem, the next question was, well, do we have enough connections? Or is is Cord, for some reason, not returning these connections or making them available to people? And so how many connections are actually in use at any given time? If that number was less than the full number, which was supposed to be 16, I think, in this case, that would have been very suspicious.
Dave Pacheco:And eventually, we were able to find out that it sure seemed like that was the case.
Bryan Cantrill:Well and I think it's very tempting to be like, oh, okay. Well, there are only 16 connections available. We're obviously running out of them. Like, double it to 32. I I just feel like I mean, this we've all had experiences where someone in the room is like, just double it and let's push that into production.
Dave Pacheco:And and we definitely asked that question. And the the observation was like, well, never really care the cockroach is definitely a lot better than a lot of traditional databases and stuff like that, and it will refuse things when it's like, I'm overloaded right now. I can't I can't serve this. But we haven't actually characterized what's safe. So what you don't wanna do is just, like, bump all those limits way up and turn all these failures into much worse failures, much worse latency, for example, because all database queries are now terrible.
Dave Pacheco:That that's basically why we didn't just do that.
Bryan Cantrill:And I also felt like we didn't have the evidence that we because we we we were like, okay. So if we're if we're running out of connections, we should be able to see that. We should be able to see the number of connections, like and we should have, like, yes, we're running out of all of them some of the time. We should be getting close some some other fraction of the time. And it's like, we just weren't able to find the the evidence to support that any of that was happening.
Dave Pacheco:Right. Yeah. That's that's also a pretty good reason.
Adam Leventhal:Yeah. There are some circumstances where, yeah, just treating because it's easy to treat is fine. But this is one where, let's say, you had doubled it and the problem had gone away. Well, then we just people still wondering, well, is it gone now? Is it gone forever?
Adam Leventhal:Like Totally. How far how far down the track do we push it?
Bryan Cantrill:And how far down the track do we push it? If it if it had gone away.
Adam Leventhal:If it
Bryan Cantrill:What what is really scary, knowing the root cause, is like, it's actually completely conceivable that it would have gone away for completely unrelated reasons.
Adam Leventhal:Totally.
Bryan Cantrill:And the and you know, we've got a system where it's just like, you know, if we were to make that change, mean, one of the nice things about Colo is it's a production environment. Like, we're not just gonna like slap something on there. We are gonna make the change and that it properly. It's gonna go into a release. That release will will happen some number of weeks later.
Bryan Cantrill:And I mean, this is like a we won't know for weeks whether it has resolved the issue. And that all the more reason to be like, what more information can we gather out of the system? And as we're looking at it, it's like, this doesn't add up at all. This is this is that's the wrong direction. And it felt like it just felt increasingly like something is amiss at at at somewhat of a deep level because it just doesn't feel like any Dave, don't know what what your take was on it, but it's just like, it just doesn't like, there's a huge amount of like missing time here and either something is going wrong with the way that Corb is scheduling claims.
Bryan Cantrill:I think that was like a reasonable I I I wouldn't quite call it a hypothesis, but I think kind of questions to ask is, you know, what was Corb what was the what were we processing claims in a timely manner? Or was there some way for something to be in queued somewhere and have to be picked up asynchronously? And that's where we again, we had we had enough instrument we we had instrumentation there, but not quite enough to be able to say conclusively that, no, Corbus is is definitely not the issue. And I I mean, I think at at this point, I guess, I'm trying to kind of replay it, but at at, you know, at some point, we get to the you you get you whenever you're debugging something, you get to the point of, like, desperation where it's like, okay. Now, like, there's there's we're like and does anyone have any ideas?
Bryan Cantrill:Like, does anyone know any jokes? I mean, you're you're just like, what the what's kind of try anything and out of it, it just it it is a a reminder of, you know, the greatest podcast that we never recorded on the the TLB speculation issue that we found with AMD.
Adam Leventhal:So good.
Bryan Cantrill:And your although I feel like we did hit on this in the C SPAN for debugging episodes. Don't you
Adam Leventhal:don't you take this episode away. We're doing this episode someday.
Augustus Mayo:Don't you
Adam Leventhal:say, oh, well, now that I've mentioned bit
Bryan Cantrill:of it. I thought you were jumping all over me because the need that for a chime. You're just like, add a chime. No. You you you you gotta you you there are limited number of chimes.
Bryan Cantrill:I can't just ring the chime all the time, pal. I'm not sending something that's
Adam Leventhal:I'll ring the chime. That was a good one. C Span and Debugging. I was into that one. But what I mean is we are sitting on a banger of an episode with that TLT speculation.
Adam Leventhal:I've been angling for that one every week for the last two years. We're gonna do it. So don't True. We're gonna for like the shorthand version and then tell me, oh, we we basically did that episode.
Bryan Cantrill:We basically did it. Ring the chime for this episode. Okay. Look. Yeah.
Bryan Cantrill:I I I hear you. But it was in that was a good example of one where we got, like, desperate. And you're just like, okay. Yeah. Any suggestions are are just like, does anyone any suggestions are welcome, basically.
Adam Leventhal:Yeah. Well, just to be clear, and this is a little bit of a teaser for that episode. I think you said, are any suggestions welcome? And Dave and I said, I don't know. VMbug?
Adam Leventhal:And you proceeded to explain to us why that was the dumbest thing you'd heard. Dave, am I misremembering?
Dave Pacheco:I don't think you're misremembering. Oh, anyway. Unfortunate.
Bryan Cantrill:It's gonna be
Adam Leventhal:a great episode.
Bryan Cantrill:Jump in part of that one a little bit. I thought I could I I thought if I interjected myself quickly enough, I could alright.
Adam Leventhal:Well No. No. But yeah. Okay. Apparently, you've learned from that lesson, and now real dumb dumb ideas are really welcome.
Bryan Cantrill:This is why we actually record every meeting. So we can all go back to that and actually
Adam Leventhal:yeah. Yeah. You know,
Bryan Cantrill:I I I think it's I think you're being a little reductive, but yes, I understand what you're getting at, and I don't disagree. Got it. You you need not queue the recording for me.
Adam Leventhal:It's because I wasn't thinking about that at all. What are you talking about?
Bryan Cantrill:That's right. But we and in particular, I mean, Dave, now we're just kind of brainstorming like what what's gathered also some information about the system. Yes. Yep.
Dave Pacheco:So Sean had the good idea of, you know, he worked on Corb and was like, we have some DTrace probes in here. And that's when we started tracing things like there's claim start and claim done, and that gave us the distribution of how long things were waiting for a database claim in the first place. Something I didn't mention about the errors, and I don't know, I'm not sure if this was probably not obvious, but we were seeing some explicit errors, but we were also just seeing latency, and we were mostly tracking the latency. The difference is that the policy of this pool is that if something is waiting for thirty seconds or something like that, then the the latency turns into an error. So most of these were So I guess what I'm getting at is the error message pointed us in this direction, but it was latency that we were tracking because most of the By this point, the instances we were dealing with were not that bad, bad enough to turn into errors.
Dave Pacheco:So we were looking at the latency of claim acquisition, and we also were looking at how long these claims were being held for, which are actually two different probes. I forget what they're called. It's like handle claimed and handle returned or something like that. And they had sort of a similar how to describe this? The high end points were the same.
Dave Pacheco:Like we saw some claims held for we saw one claim held over eight seconds, but we would see like 30 things blocked for eight seconds, which is pretty surprising, right? I mean, there's at least hundreds of other claims being made and claims being held for much less time than that. And it's conceivable that it had been queued, that stuff had been queued and that those connections were all busy. But it was pretty surprising
Bryan Cantrill:to
Dave Pacheco:be like, how can 30 things have been blocked on this one claim when we're supposed to have 16 connections to this thing? And that's when I think we started trying to trace the number of claims outstanding at a time. And so we were doing that with some of the same probes, but the problem was that only gives you a relative difference. Like, you have an integer that you can increment and decrement. That's like, how many connections do I think are used to the database right now?
Dave Pacheco:But you don't know what the starting point was, so you don't know really how many are in use. But we had some way of correcting for that. I forget what it was. And we found that there were only ever like nine connections in use, that wasn't most of the time. Most of the time there were like two or three.
Dave Pacheco:And so that this is definitely putting together an alarming picture, particularly around Corp, which is like, why are things waiting so long for a connection when there should be more connections available? And there's definitely not enough in like there are multiple reasons to believe there are more connections that should be available. One is that the policy should allow many more, and the other is that only one of them is actually in use, and we know there's a whole bunch of them available. There are a bunch of them established. Yeah.
Dave Pacheco:But the but the one of the tough things about the so okay. So just continuing down that path. The next thing I want to do is figure out what code path is making these claims, particularly the claims that are blocked well, both the claims that are being held for a long time and the claims that are being blocked, right? Because that will tell you what is logically blocked on what, right? And that might, you know, that'll confirm that it's the HTTP request that's blocked, and it might also tell us, like, why is this thing holding a claim for so long?
Dave Pacheco:And unfortunately, this is where the async, the Rust async stuff really starts to bite us because these things are happening part I mean, yeah. So many of these events are happening in different tasks than the ones that are actually doing the work. And so, you know, the usual approach here would be in DTrace to grab a UStack at the point when a claim is acquired or returned to the pool or something like that. And those stacks were not useful in terms of telling us what part of the application was using those things because they were happening in a different task.
Eliza Weisman:Dave, is this when you start asking questions that start making me pretty uncomfortable?
Bryan Cantrill:That's not a loaded question at all.
Dave Pacheco:I'm not sure at exactly what point you started feeling uncomfortable.
Eliza Weisman:Oh, well, I started feeling uncomfortable a while ago, but so that's the side.
Dave Pacheco:Yeah. I mean, this is definitely the line that led us to wanting to say things like, if we could know what Tokyo task it was that was doing these things, that would help a lot. So when you're using Dtrace for a threaded program, it's a common pattern to be like, have event one that have thread, and I set a thread local variable. And then some event two happens, and I have a probe conditional on that. And maybe I collect some more data, etcetera, etcetera.
Dave Pacheco:But with tasks in Rust, there's not a great way to do that with dtrace because the things you have are probe points, and you have information about what thread you're on, but the thread you're on is changing what task it's running constantly. Sorry. Is my audio getting worse or is it just continuing to be a little quiet?
Eliza Weisman:It's it's fine. Okay.
Bryan Cantrill:Your audio is great. We're all just basking in the image that Adam dropped in the channel of the C SPAN for debugging which is I mean, Adam, it is I I not to take anything away from your physics simulation, but I really do think it's hard to define his word.
Adam Leventhal:I think it took longer than my physics simulation.
Bryan Cantrill:That makes me feel so much better. I just I I also just love I mean, it's it's your facial expression on there that is the chef's kiss. I think your facial expression of just Like what the fuck is going Like this is not nothing makes sense right now. Yeah. Sorry, Dave.
Bryan Cantrill:Wait. Wait. Wait. We're making Eliza feel feel increasingly uncomfortable.
Adam Leventhal:Because because you're asking awkward questions now of Tokyo, Dave. And Tokyo.
Bryan Cantrill:Yeah. Right.
Eliza Weisman:In particular, Dave is asking questions like, is there a way to figure out what task I'm in when I'm when, like, these different, like, Tokyo internal functions are on the stack? And the answer to that is well
Adam Leventhal:Put your
Bryan Cantrill:model here. You see,
Eliza Weisman:well, you see, it's so there's there's, like, all of this stuff going on involving, like, type erasure at runtime, and then sort of, like, if we had gone back and added all of this instrumentation to Tokyo when you compiled this binary, maybe. But a lot of this information, you know, you can't reconstruct because it it was known at a point in time that is no longer now. So it's like
Bryan Cantrill:That's right.
Eliza Weisman:You start answering these questions that
Bryan Cantrill:are I just love Eliza, I love your bedside manner. Is program dead, doctor? Is that you the I It's like, yeah.
Adam Leventhal:Well, what what you really should be asking is should we have treated the program for this disease earlier? So the answer is emphatically yes.
Bryan Cantrill:Emphatically yes. That the time to treat the disease was at a time that is not now.
Adam Leventhal:Right. And Dave, is it fair to say that part of it is, like, we've spent so long debugging this multithreaded programming model that has kind of been a big deal for the last thirty years of computing? And there's a lot of detrace orientation around it. There's lot of debugger orientation, not just MDB, not but but lots of debuggers orientation around it. And we're sort of good at knowing, okay.
Adam Leventhal:Where is this thread right now? This other thread is blocked. Where is it right now? And when you get into the the async model, the Rust async model in particular, you've got these little state machines whirring away, but it is we have do not have the same corpus of experience in terms of how to infer state about the system, in this kind of new system, you know, that looks and feels a lot and operates a lot like this multithreaded system, but it's quite different.
Bryan Cantrill:Yeah. We and this actually, Adam, dovetails in with a a cliff that was something that I really like, which is the program counter is a very important piece of state. Yes. And it is very nice to know in a system, where is everybody right now? Yeah.
Bryan Cantrill:And the problem is in an async system, you got the the the there are other actors that know where these things are, but they've kept their state in a way that you can't get to it. That's right.
Adam Leventhal:And you make some program counter plus a stack pointer? Man, that's that's big. A lot of state all
Eliza Weisman:of sudden. Think it's important that, like, the program counter and the stack pointer are architectural state. Right?
Bryan Cantrill:Right. And in the
Eliza Weisman:async world, all of this sort of additional information that you want is something that exists in the user space software that you're executing. You know? It's in a library. And, you know, with work, can pry that information out of the library, but it's not sort of like inherent to the x 86 CPU. There's always a stack pointer.
Eliza Weisman:There's always a program counter. You can go and look at those things because they're like part of the world in which we live. It's just sort of like something that the program happens to be doing is what's interesting to you.
Dave Pacheco:Yeah. Would only say I would say which is like the OS knows about threads and the stack pointers and things. And so these debuggers already know about all these things. But it's a harder problem because all of these things in an async program are just, like, properties of the application specific structures in the library that's doing that scheduling. And so it's intrinsically harder, think.
Dave Pacheco:Every debugger would have to know about every user land scheduler and its data structures and where it stores things and things like that.
Bryan Cantrill:For sure. Yeah. It is hard. I mean, and and you got you got to have you're gonna have semantics at user level that are gonna be specific to that kind of run time. And it's just you're introducing this layer of indirection, that can be very powerful, but can also be make it really hard to understand what the system is actually doing.
Bryan Cantrill:So Dave, you're trying to piece together the what's going on from a a Tokyo perspective and try and getting the disconcerting news from Eliza that the time for that information was when it was being compiled. It is not now. And they where where you're trying to go through kind of a production binary and like, can I piece together this information? And some this is a great strength of Rust is how much it knows at compile time. But a a challenge for when we wanna debug these systems, there's fewer artifacts in that production binary and that some stuff is like, yeah, it's just gone.
Bryan Cantrill:That program does not keep track of that state and you do not have an easy way of getting to it.
Dave Pacheco:Yeah, totally. So I think the questions at this point are basically what is taking so long? What is the thing or things that are taking eight or nine seconds? And what is the dependency between the HTTP requests we're trying to complete and those things? And both of those were kind of hard to answer.
Dave Pacheco:And, you know, we started from the probes that we had in the components that we had. We were able to exonerate some stuff. We were able to maybe not indite, but like have an area where we wanted to ask more questions. And but a bunch of the things that we a bunch of the techniques that we normally or I mean, normally historically have used to try to figure out context were just not working. And so what I ended up resorting to in was actually kind of helpful was I used the PID provider to trace all the entry and return probes in Nexus for functions that had Nexus in the name because it was too much.
Dave Pacheco:I didn't want to trace actually, I think I tried tracing all of them first, but and then I narrowed it down. Just to have a I think I used the ring buffer policy in DTrace to get
Bryan Cantrill:Oh, there you go.
Dave Pacheco:Yeah. Because I was basically like, Okay, so if I can basically exit my Descript at the point where we have just been off CPU for a long time, then
Bryan Cantrill:I can go back
Dave Pacheco:and figure out what were these things doing before that. But at this point, I don't yeah. At this point, we still did not have
Bryan Cantrill:This is super hard. Oh my This is super hard. Ugh. Because what you're trying to understand is it is so hard to debug a system where it's like, okay, I know, like, I was just conked out. Like, I I've been I've not been running for a period of time that is too long.
Bryan Cantrill:And you wanna answer the question like, what the hell was just going on in this system? And that can be really, really hard to ascertain.
Adam Leventhal:Yeah. You mean, like, you know, up until this moment, like, what happened? What are the last few events or whatever
Bryan Cantrill:that occurred?
Dave Pacheco:It's like,
Bryan Cantrill:It wasn't you. I mean, is the part of the problem is you're like, no. Like, you all I know is that, like, I came to in this, like, in this gutter. I don't know how I got here. I you know, my my my my last memory is, you know, going to the bar and here and I like, I'm trying to piece together what happened and who did what to me.
Bryan Cantrill:It's like, well, you were actually, like, you were unconscious for I mean, it's like, you know this is like the hangover for programs? I don't know what there there needs to be, you know.
Adam Leventhal:This is a little bit neither here nor there, but have you seen this thing magic trace from Jane Street?
Bryan Cantrill:It it Oh, yeah. Yeah. Yeah. Yeah.
Adam Leventhal:Yeah. It it it kind of, like, scratches this itch a little bit. It does have, like, nontrivial performance overhead, but it I think it basically built a ring buffer of branches taken. And from that, you can infer kinda where have I been. But I think it's Intel only.
Adam Leventhal:But it and I've never used it, but it seems really neat.
Bryan Cantrill:Yeah. And, Dave, did that bear any fruit?
Dave Pacheco:That particular thing, I think, was helpful later. The I think most immediate next step at this point was so we used the core probes that we did have to track basically everything that was happening with all of the core pools in the process. So all the claims, all of the like, sorry, what I mean is claims from the pool's perspective in terms of when things are like how long it takes for acquisition and then all the returns and basically just like dumping it all and trying in the Descript to keep track of how many connections we thought we had and what was still available and lining that up with a I think it was a speculative DTrace speculation. What's that?
Bryan Cantrill:I think before we were doing that, I think because I ran my first statement out before we were doing that, I think.
Dave Pacheco:That could be. The thing I'm remembering is so this may have been before we were losing speculation, was basically being able to dump out, like, that we had been off CPU for a really long time.
Bryan Cantrill:Oh, got it. Got it. Yeah.
Dave Pacheco:And then back at all the core of activity. And what that showed, which
Bryan Cantrill:Oh, so maybe you're using speculative tracing for that as well. You know?
Dave Pacheco:Wish I was, but I'm not positive.
Bryan Cantrill:You know,
Dave Pacheco:I should
Bryan Cantrill:assume that speculative tracing was only used once in debugging this problem. It's used very frequently to debug many problems by many people.
Dave Pacheco:Yes. The order here is definitely a jumble for me. But the but this what I wrote in the thing was this was, like, at least smoke, if not fire, because what we saw from this output was that was a sequence where, you know, we we were at some steady state where, like, I think all the claims were not taken. And then we went off, we took a claim, and we did a whole bunch of work. And then, like, 30 claims came in, and they were not satisfied.
Dave Pacheco:And, like, that's over ten seconds. Then the first thing finished, released its claim. And then we saw a bunch more claims get satisfied. And that was really weird. I mean, that's consistent with everything we've seen so far, which probably were even telling with the bias of knowing what the problem was.
Dave Pacheco:But it's very suspicious, right, because you're like, you have all these claims and you didn't satisfy them for many seconds, but you also didn't make any new connections. We could see that. We could see that no new connections were made, and yet it was able to satisfy it with all these other connections. So I I think I think it was around then that you were starting to do the state map stuff.
Bryan Cantrill:Yeah. You remember? Yeah. I mean, and this is kind of an act of desperation, honestly. Or so we we this just remind us reminds me of problems we've had in the past where the system you've got a lot of different kinds of things in the system, and the system is adding up to one that does not function, and it's hard to pin it on any one thing.
Bryan Cantrill:And it's like you wanna have an entire view of the system. And I kinda didn't know where to start with that. So the first thing I wanted to go do was just generate a state map of threat activity. So not task activity, importantly, we didn't have that information, but threat activity. So state maps are a visualization that I developed back in in the in the Joynt days.
Bryan Cantrill:And when we're kind of try actually, the the the origin story of this actually is a Cassandra benchmark that was that was performing very poorly on our our joint infrastructure. And but it was a mystery because it would perform really really well. And then it would go through these protracted periods, protracted being like, if I recall correctly, like maybe tens of milliseconds, hundreds of milliseconds of inactivity. So you'd have like a 100 of just like the whole world stopped and then starting again. And you're like, why are we stopped?
Bryan Cantrill:Why why are we not doing work? And it was really really hard to figure out why we were not doing work. And ultimately, the reason we were not doing work is actually because of we were getting nagled. QR I mean, we're just we're just ringing the chime all over the place, And but it was and we were able to see all sorts of other things in doing that. One of the thing Asim was asking in the chat about, like, what was what was the the GC times like?
Bryan Cantrill:And I think that, you know, this is where, you know, you you kind of with these big complicated systems, you kinda start with these kind of knobs at the outside of it. And I really wanted to see inside of like what's going on. And so what I really wanted with this was this kind of view and I the kind of the the slightly more abstract observation was that we often have got a bunch of different entities in the system that themselves are in different states over time. And you can view that as disks being in different states, you can view that as threads being in different states, you can view that as processes being in different states, CPUs is being in different states, and you want it and and you wanna kinda correlate that temporally and you wanna look at that visually. And so the state maps are a way of of doing that.
Bryan Cantrill:So I'll I'll drop in a link to the the actual repo. It's the this is this will become the canonical repo, so as I can find someone that who controls the the old joint repos to kinda hand it over. But this is the this is software, and actually this is the first software in which I really put it in Rust actually. So it's kind of had a bit of an oxide origin story in there as well. But the this is a visualization that I that I had found to be valuable from time to time.
Bryan Cantrill:And especially valuable when I like didn't know what else to do and was frustrated. And we had used it to I mean, Dave, we used this back in the day at at joint Samsung to visualize post cross performance to look at Cassandra performance. So we get these are kind of big complicated systems to trying to figure out what's going on. One of things that I had actually forgotten about, I over the weekend, was going back to some of my older presentations on this. And Dave, I'd forgotten that we were getting right throttled because Postgres insisted on writing zeros to its wall when it had a new wall.
Bryan Cantrill:Do you remember this? Yeah. And I'm like Because it's
Dave Pacheco:It yeah. Yeah. Is this the thing where it's trying to reuse files instead of creating new ones? And then Yeah.
Bryan Cantrill:It it went to go yes. And then it it went to go create a new one, but it wanted to zero at first. Even though it's like you just create a new one, you actually don't need to zero it. So it would actually write zeros into the the new wall. And then it would get right throttled while writing the zeros and everything would just cork up behind it.
Bryan Cantrill:And then you ended up seeing semaphore weight behavior. So yeah. I don't know. Maybe there should be like a different chime from like post crests. Like post crest trauma.
Adam Leventhal:Seriously, like, oh, you mean Joiant was down again because of Oh. Oh, like a post crest problem? Okay.
Bryan Cantrill:Got it. Oh, that's surprising because it's like that it's amazing. It must be the Workday already.
Adam Leventhal:Have I already heard this episode? No. No. No.
Bryan Cantrill:It's different. Nope. Nope. Different. Actually, different one.
Bryan Cantrill:I don't even we
Dave Pacheco:even talked about this particular one before. There's
Bryan Cantrill:You didn't
Dave Pacheco:there's actually, like, at least two here. One of them, I think, was that it was trying to reuse a file, and we wanted it to create a new one. But because it was reusing it, it had to go fetch it from disk. Right. It's using these as, like, empty buffers, and it doesn't care about them.
Dave Pacheco:So it's taking the last file that it had, which it last wrote to like fifteen hours ago. Sorry that I'm going down this path now, but I am.
Bryan Cantrill:Hey. Here we are. Listen. I I yeah. I pushed you in the traffic on this one.
Dave Pacheco:It ZFS has long evicted it. And Postgres is like, well, I don't really wanna use any more disk space, so I'll grab this one from over here, which, by the way, doesn't work on copy on write. We're still gonna use more disk space. But but in the process, in order to write anything, it had to page all of those things back in. And, yeah, it was it was a bad scene.
Dave Pacheco:So we were doing all these reads from disk just to populate a page that Postgres was then going to wipe out because it didn't want to put it in a new file, which made sense on old file systems, but definitely not on disk file system.
Bryan Cantrill:You're right. And then we got it to create a new one, and so it insisted on writing zeros, which also, like, might have made sense in, you know, the eighties, but definitely did not. It's like, no. It's you don't please don't you're right. And it's like it's also like this.
Bryan Cantrill:It's hard to blame Postgres alone because like the system was already having multiple organ failure. Like, the system should not have been in a state where it's like, oh, I I can't write zeros to a file without bringing into a state. That's like, no. You can't. Know, for other reasons that have got nothing to do with you, you can't.
Bryan Cantrill:Okay? Let's just say you can't.
Eliza Weisman:Just please stop.
Dave Pacheco:It's not your fault. Just stop.
Bryan Cantrill:Just not your fault. I think just stop. Exactly. And but we had used state maps to to explore that problem and and and actually quite a bit of others. I I had kind of forgotten how mean, was useful in a lot of dimensions.
Bryan Cantrill:And so I this felt like a good problem for that because we are like and in particular, just like the fur I didn't know what and actually, Dave, I think because you and I were actually like physically together when we're working on this. And I think I I was even expressing at the time like, I don't even know what I'm doing here. This is not this is gonna yield nothing. Like this is gonna, I I just don't know what we're gonna find here. Like, what do I think I'm gonna find?
Bryan Cantrill:And
Dave Pacheco:But I you were a little skeptical about it, but I feel like that is a good that is a good time to ask those questions sometimes when you're like, I don't know what I'm gonna find. Right?
Bryan Cantrill:Yeah. And I think that the that's it. And I I think that, like, I am wondering kinda what questions to go to to go ask. And, like, I don't and I think this is what I've kinda realized about state maps is they are rarely going to have the answer, but they are often gonna promote new questions. And if you're especially if you're stuck, it's like you can get new questions.
Bryan Cantrill:So I just dropped this. I guess we have yet a a third chime for whenever I say Sphig, but we got a I've just dropped a Sphig in at which was the result of a descript that I will also drop in here. And so to to look at this, for those who are kind of live, what you wanna do is actually download that thing and you wanna actually pull it up in your your browser because you you want this is this is a Derek, is this malware? It's like, well, what is malware exactly? I did it this is it's a Sphig with a program in it.
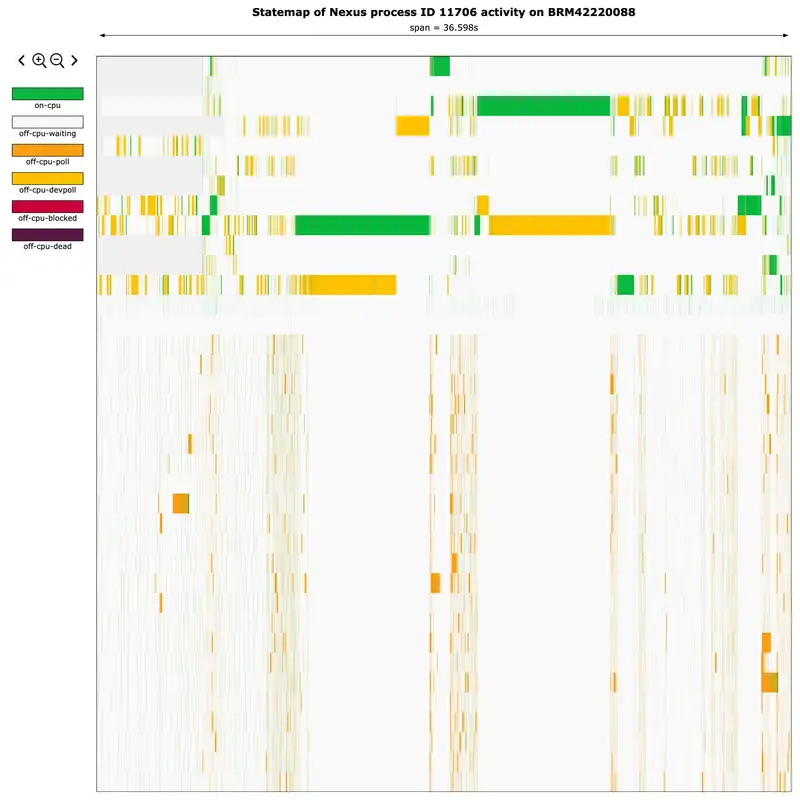
Bryan Cantrill:Maybe a big program. But you if you pull that up, you will see and this is a much more visceral appreciation and this is the actual data that we that that Augustus pulled off of Colo where we've got down that that left side and if you go kind of click anywhere in there, you'll it'll be a little clearer what's going on. Down that the the all of these these different rows are different threads in the system. And the different color over time is showing you the state of everything over time. And this, I don't know what I was expecting, but I was absolutely not expecting this.
Bryan Cantrill:This was like a I I think what is Richard Feynman's line when dropping the o rings in the ice water and having it like crack during the hearing. Like, this seems very relevant to our problems. And in particular, if you kind of pull that thing up, what you'll see is you see two different threads at two different times with these long stretches of green. That is on CPU. We are not expecting that.
Bryan Cantrill:This is not we do not expect this thing to be CPU bound. And that gets really really interesting. And if you if you kind of bring that thing up and you can you can click in the middle of that green and you can Dave, one of thing I I added just recently that I I think it's gonna change my relationship with state maps. This is but just key bindings, you don't actually have to click on the plus sign to zoom in. So you can just like, if you hit plus, you'll zoom in on the keyboard or and minus will zoom out.
Bryan Cantrill:It And then then the other thing I did is that if you if you hit shift if you if you click on something it highlights the entity. If you hit shift and then up, it moves to the entity above it. So you can use shift up, shift down to just kind of scroll through the entities on the system. And then you if you zoom in there, if you do shift left and shift right, it will take you to the next state for that entity. So it is like way easier to move around these things to kind of figure out what they're actually doing.
Bryan Cantrill:And in this case, like why is this image just like a a real smoking gun is like we have got this long period of green and in that period of green, there is nothing else happening. And if you if you click on kind of one end of that green and then you shift click at the other end of the green, it will highlight the actual time delta in there. And that time delta is like the Augustus, you're reporting kind of eight to eleven second kind of delays and this really neatly lines up. So this is like, okay, I don't know what I was expecting, I was not expecting this. And this felt like, okay, this feels like it merits investigation for sure.
Eliza Weisman:And specifically, what you're looking at when you look at this state map is you're looking at a work stealing asynchronous runtime kind of not being those things for about every ten seconds every couple of seconds.
Bryan Cantrill:Yeah. You're definitely seeing and but and and for unclear reasons, sort what you're definitely seeing is like, you got something doing work. And this again is the thread view, not the task view, but you've got something doing work and then everything else not doing work. And the and then you kind of got these other periods where then work is being done and then not doing work. And the thing is also interesting is like you can see these shorter periods of green too in there where also work is not being done.
Bryan Cantrill:So it's like it was there are these you have these long stride, but you there is something going on here. And is it because there is a resource that these other things need that that compute out threat has? I mean, what is what is actually going on? And Dave, this is where I think we used ended up using speculations again. I because it sounds like you'd already you'd already used them.
Bryan Cantrill:But used speculative tracing and I'm gonna drop a a descript into the channel there of using speculative tracing with the profile provider, which I'd actually not done before to try and and the the the idea here is like, okay, this is actually an easier question than the one you were trying to answer Dave with speculative tracing. What you were trying to answer is and speculative tracing, just to kind of back up a little bit. Speculative tracing is effectively a way of just reducing the the trace data that's moving to the system by saying like, look, I don't know if I'm interested in something at the time. I only know that I'm interested actually after the fact. The motivating example for way back in the day was a program where this is cruel.
Bryan Cantrill:Ended up being of course an OS bug where literally one out of every 10,000 mMaps would fail with eInval. And, you know, if you if you know anything, mMap, mMap is the system called to to to create a memory mapping. You're like, oh, well, eInval, like how many places return the eInval? Like and okay. What are some other ideas for figuring out what's happening?
Bryan Cantrill:Because that's it's like, oh, there are like, you know, 4,000 places that can return e. I mean, it's just terrible. It's all it's all overloaded in the invalid. It's like you got six different arguments and they've got all sorts of ways to be invalid. And it's like you actually wanna kinda instrument everything and then only decide like, oh, I'm returning invalid.
Bryan Cantrill:Now I am interested in all that stuff that I traced. So you still have the enabled probe effect, but you are are really reducing the the kind of the cognitive load in terms of processing this to the stuff that you know is interesting.
Adam Leventhal:But not just the cognitive load. Because you're as you're saying, it it is possible to just dump everything out and sift through it later. Sift through
Bryan Cantrill:it later. Yeah.
Adam Leventhal:Possibly. It may be possible to dump through dump it all and sift through it later because it's it's not in a format that is really, you know, you know, default, very easy to run that kind of query against it. And even then, you're you're dumping out may overwhelm the system just in terms of the data that you are trying to squeeze out of it. So it's For sure. It it it certainly reduces human cognitive load, but may also just be enabling in the use case.
Bryan Cantrill:Yeah. Yeah. That's right. And it's and this is one of the things in there. I think there are a couple of things like this in DTrace.
Bryan Cantrill:It's like, if you don't need this, you just kind of like stare blankly at it and be like, the hell is this? But if when you do actually need it, it you you you do kind of need it. And Dave, you've been using it earlier to try to ascertain what had happened when you were off CPU, which I think is hard harder. But now we actually wanna use it to ascertain what we did when we were on CPU. So in this case, what we wanna do is like, alright, we're gonna fire a profile probe that's gonna fire, you know, 1,234 times a second.
Bryan Cantrill:If we have an active speculation for that thread, then we are gonna we're gonna record a a stack back trace. And then when we when we actually go off CPU, if we've been on CPU for what we think is like a notably long time, we're gonna commit that and we're gonna see all that. And Dave, you were looking at the output of that. It's like, that was pretty interesting.
Dave Pacheco:Yeah. So the yeah. The stack traces that we got from that were all the same thing, which kind of makes sense. And it was a background task that runs in Nexus that we call the external endpoints background task. So its job is to look at all of what we call silos.
Dave Pacheco:So just backing up a tiny bit. Silos are what they sound like a unit of isolation in the oxide system, and each one winds up having its own API endpoint with its own DNS name. And so but they all end up pointing that the quad a the a records for those DNS names all wind up pointing to the same set of underlying instances, and we use HTTP and TLS level stuff for figuring out which endpoint you're trying to talk to. But in order to do that oh, no, because they all have different DNS names, they also potentially have different TLS certificates. So in order to figure all that out, we have this background task that queries the database and says, What are all the silos that exist, all the DNS names that I need to be operating, and all the TLS certificates that exist?
Dave Pacheco:And it assembles a data structure that it can use to quickly figure out when a request comes in, which certificate should it be serving and what silo should its operations be constrained to based on the DNS name? And the whole point of this thing Yeah. Go ahead.
Bryan Cantrill:Strictly a background task. Right? So this is like a background task to enable us to move fast.
Dave Pacheco:That's exactly right. The whole point of this thing is to take all that complicated calculation and stuff out of the request path. By doing this in the background, we do it, like, once a minute, and anytime we know things have changed. Even once a minute is way too often. But it basically assembles this thing outside you know, no locks held, no anything, just, like, fetches this stuff and then uses rust watch channels, which are super nice for doing stuff like this, which is basically you know, everything that needs this has a watch receiver for this value.
Dave Pacheco:And this one code path that needs to change it once in a while could just send an updated value to all those things.
Bryan Cantrill:And anyway,
Dave Pacheco:that that's how it is supposed to work, and that is how it works. But this thing was spending an enormous amount of time on CPU.
Bryan Cantrill:How It's really okay. Not a surprise that it's like we're doing some CPU work for this. Definitely a surprise that we're not doing anything else apparently because we're doing this. And then August says, this is where you realize, like, actually, there's another issue on here. We actually just have too many certs on this thing.
Augustus Mayo:Yeah. Not like a little too many,
Dave Pacheco:like a lot too many.
Augustus Mayo:Yeah. We we had a renewal issue where we kept writing certificates that we thought were valid, but were not. And I think we got to close on close around 10 k or so. So that it's way more than we expect given the number of silos, and we knew that. Ironically, I I'd run into that prior midway through the day just because our certificates were expiring, and I was like, oh, well, it's time to go renew them and fix a couple
Dave Pacheco:of these
Augustus Mayo:silos. It didn't really happen till I was 25% through processing this fixing these that we got an act got the spectral tracing, which those two things were just top of mind at that point then, and that seemed very suspicious.
Bryan Cantrill:You when then also you're like, wait a minute. This would also make sense because this now correlates to when we kind of began to saw began to see this on colo. What we kind of correlated when we had this kind of explosion in certificates. And so on the one hand, we're kind of and they then I think at that point, you're like, okay, I can get rid of these extra certificates that we don't need, and we can see if the problem improves.
Augustus Mayo:Yeah. So that was, like, nicely an an easy thing for us to do, after all of the difficulty of getting data out, like removing the invalid certificates and just testing the system again. And we saw real, like, steps as we went down. The delay that we were seeing, the latency we're seeing was continually going down to the point where it was not exactly gone, though. We still had, like, around five to seven hundred milliseconds of delay.
Augustus Mayo:But that's much less noticeable for a user who's just clicking around, just feels like a slow request. But that's still unexpected in the system. There's no reason that a handler should just sit there for nearly a second doing nothing as or from what we can tell.
Bryan Cantrill:Right. So the problem did not completely go away. We kind of ameliorated to the point, like, okay. This is and I think in particular, we it was good to get the the some confidence that, like, this is feels less likely to be a regression. I mean, you don't wanna be too speculative about that when you are we don't actually have a true cause.
Bryan Cantrill:But this feels like this is less likely to be a regression. And we can kind of deal with the immediate problem in colo, But now you get the problem of like, wait, what? How because Dave, as you were saying like, this is no, this is like a back like these things are not related. Like this can't be causing that. I mean, it is obviously.
Bryan Cantrill:There's obviously a causal relationship here, but it also makes no sense that there's a causal relationship here.
Dave Pacheco:Yes. Both halves of that are true. This makes no sense, and the data that it is related is extremely compelling. And it turned it from this is an incident in our production system to, okay, the production system is now fine, and we've got a pretty good idea that this is I mean, as you said, not definitely, but probably not a regression and probably pretty reproducible
Bryan Cantrill:Right.
Dave Pacheco:By by loading up a dev configuration with the same stuff. And so it kind of changed the tenor of of how we were
Eliza Weisman:approaching it at that point.
Bryan Cantrill:Yeah. And and not that we would have ever done any different, but I do love the fact that, like, of course, we are it would be tempting to like, okay, well, we fixed the problem on colo. It's like, no, no, Now we we've I mean, great that the the fire is out there, but now we've got something that we can potentially we can use this information to actually reproduce this where we can actually completely understand this. Like we are emphatically not done with this problem. This problem is because this we understand things about it and we understand enough about it importantly to reproduce it, but we're definitely not done.
Bryan Cantrill:So Dave, you started to reproduce this on one of our racket configurations. Right? We've got like the couple of of dev systems where which are smaller configs that we are kind of smallest possible racks that we call Racklet. Because I think you were you were reproducing it on Racklet. Right?
Dave Pacheco:That's right. Yep. I reproduced it on Dublin, which is one of our Racklets and it was very readily reproduced. I wrote a script that installed 10,000 certificates because that's what Augustus had said we'd had and was able to see the same I didn't do a state map, but I saw the same pattern of looking at CPU utilization per thread, and one thread would go on CPU at a 100% userland CPU time for, like, ten seconds. And during that time, HTTP requests were taking a pretty long time, and they were totally fine otherwise.
Dave Pacheco:So it's the same set of symptoms that we had seen in Colo, so I had a good feeling like we'd reproduced not just the symptom, but, I mean, probably the same problem.
Bryan Cantrill:Great. And and the nice thing about it being now on a dev system is we can now actually iterate and we can throw new software on there. And in particular, Eliza, you'd kinda seen this the previous week and had an idea of how we could better instrument Tokyo to answer Dave's questions.
Eliza Weisman:Yeah. So that's right. Dave had just been asking me these kind of uncomfortable questions for Tokyo, I think, last week. And this week, I I started in my copious free time kind of thinking about what can we do. And one of the things that I reached for is Tokyo has, in its unstable features, it has these, I call them runtime hooks.
Eliza Weisman:I'm not actually sure if the Tokyo documentation calls them that, but they're callbacks that you can set when you're constructing the Tokyo runtime that it will fire when certain events occur. In particular, it has ones that fire before and after it pulls a task, like when the runtime worker thread starts to pull a task and then when it finishes. And then it has similarly, it has callbacks for when a new task is spawned and when a task terminates, and those are given the task's ID, which is sort of an opaque identifier. And then there's some other stuff related to the lifecycle of worker threads that aren't directly relevant to this, but that it also gives you. And I thought, you know, we could at the very least put DTRACE probes in there, put USDT probes in these, and they could, you know, tell us at least when we start pulling a thread and when we stop pulling a thread, you can then set a thread local in your descript that says or when sorry.
Eliza Weisman:When you start pulling a task and you end pulling a task, you can set a thread local in your descript that says, this is the ID of the task that I'm pulling, and then you can correlate every other probe that happens on that thread with which Tokyo task it's actually in. Now there's some information that is kind of missing from this because these only get these numeric task IDs and not really any information about like where in the program those tasks came from. But so I I showed this to Dave, and I was like, hey, Dave. I've been working on this thing. It might be useful for you.
Bryan Cantrill:And this is one of those where well, you know, we we we talked about before. We kinda do demos on Friday. This is one of those where it's like, we we cannot wait for Friday to the demo. This is like, sorry. The you know, I I I mean, the showmanship is a top priority at Oxide, but it's not the top priority.
Bryan Cantrill:And there are times where our and this is where we actually need to stop a clinical trial and actually just distribute the the actual the drug. And Dave, you're like, I don't wanna spoil anything that Eliza might have in mind on Friday, but we have a great crate here that's gonna allow it.
Eliza Weisman:Well, it I did show it to Dave in DMs because I I wanted to be able to surprise someone on demo Friday.
Bryan Cantrill:Yeah. Sorry.
Adam Leventhal:I hope
Bryan Cantrill:that someone was not me. I but I was I I was still surprised though. I kinda feel it's like, you know, it's always a surprise. This it was it was demo Monday. It was great.
Bryan Cantrill:Or demo Tuesday. Can't remember where it was. But
Dave Pacheco:and And Eliza and I had been talking about it for because this was like a week and a half later, I think. It had become less less urgent, but we still obviously wanted to do it. And we've been talking about it, and then the PR went up. And then I don't think I told Eliza that I just the thing I installed on the Racklet was the branch from her PR so that I could I was like, well, this seems like it'll be probably pretty useful.
Bryan Cantrill:Yeah. Absolutely.
Dave Pacheco:Was the, let's not wait for the clinical trial.
Bryan Cantrill:No. We did get we're not gonna wait for the trial to complete. The the the other thing that's important and, Dave, this is you were giving me a very helpful primer in terms of Tokyo parlance versus maybe what colonel parlance is. When Eliza, when you say polling a task, that it it's that is not pulling on, for example, file descriptors waiting for something to do the way it would be in the operating system. When you are pulling a task in Tokyo, you are you are executing that task.
Eliza Weisman:Yeah. It's kinda the opposite of that.
Bryan Cantrill:Right. Right.
Dave Pacheco:I assume that the name comes from using pull in non blocking mode, and it is like you're calling pull and finding out if there's anything to do. Yeah. But in but if you're just thinking about it in the usual blocking mode, it's the complete opposite. Right?
Bryan Cantrill:It's like It's the complete opposite.
Dave Pacheco:This is when I do the compute stuff, not the
Bryan Cantrill:blocking stuff. This is when I do the stuff when I'm pulling, which is fine. Actually, I I'm you know, it was actually just very helpful to have the okay. I can deal with the the the nomenclature shift, but it's a very important nomenclature shift. And this is huge because this allows us to to really now begin to correlate what Tokyo task is doing what.
Bryan Cantrill:And there's still I mean, as you mentioned, like, there's there's still stuff that we would like, but now we can really begin to see what's going on from a Tokyo perspective in addition to from an from an OS thread perspective. So I've got fitting way another state map here. So that I just dropped into the chat and folks can go look at that. And so this is showing the result of Eliza, this is running with your crate. So with the the Tokyo probes and with a script that I'll also drop in here in a second, that is generating the kind of the raw output for this.
Bryan Cantrill:And now what we have on that that that y axis are not threads as they were with the previous state map. These are now Tokyo tasks, which is awesome. So we can actually see now on the one hand, and Eliza, you mentioned this like, okay, these are just like integers. But hey, integers of chart, we can actually correlate, you know, we we don't know exactly what they're doing, but this is actually really, really helpful. And in particular, if folks pull up that state map and you can see now that we this is running over to the court.
Bryan Cantrill:Dave, this is running with the workload that you had on there. And we knew we would hit this, you know, once a minute or so. Or was that by design that once a minute or was that just kind of an artifact of Yeah. I'm not sure.
Dave Pacheco:Well, that background task runs once a minute and it always Oh, there you go. Okay. Always recomputes everything from from scratch by design. So, yeah, this was a very regular problem, fortunately.
Bryan Cantrill:So if so you can see that that big green in there. And if you you can go to the end of that state. If you actually type if you if you kinda click the time at the end of that state, if you just type in five m, it will set the time bounds at the top to be five milliseconds. And you can see that you've got you it we're doing nothing else. And then we start to do other things.
Bryan Cantrill:And in particular, if you if you kind of click up there, like so if you look at this, we are on task eight thirty three and then we see that we are actually task one thirty six is what we execute very shortly after we're done with what we now know is the certificate processing task. But the question that we had was or the question I had, it was it seems like the that next execution is despite being ready to run, it's executing on that same operating system thread. And we can explore that by actually the this state map is is we'll call a tag state map where I tagged the whenever a task is run, I tag it with the actual thread. And if you click on that executing state, while you've got that up, you'll see it. It'll show you the tags for executing including the thread ID and then you can see the thread IDs that are actually executing and what you can if you click on those, it'll highlight in blue.
Bryan Cantrill:Like for example, we can see that in this particular case in that first act of green, we are on thread one fifteen, which is the operating system thread now. So now we have the the task to operating thread binding. And we can see that that first bit that we executed afterwards is also on thread at thread one fifteen. So task one thirty six and task eight 33 were both on thread one fifteen. And Eliza, when you saw this, you immediately like, okay, actually, I recognize this this particular pathology.
Bryan Cantrill:Or that's way it seemed. It seemed like you had an instant recognition for this pathology.
Eliza Weisman:Was that me? I I mean
Bryan Cantrill:I think it was. Wasn't it?
Dave Pacheco:Is Dave.
Eliza Weisman:We were on this call. I think this may have been some I think you you said the magic word, and then I think I John and I maybe both at about the same time reached for the answer to the magic word.
Adam Leventhal:Damn it.
Bryan Cantrill:What
Eliza Weisman:was magic word? I I The magic word is work stealing, Brian.
Bryan Cantrill:Oh, work stealing. Yes. Well, you know what? It's funny because what I did it did remind me of a a bug we had in the kernel way back in the day where if work would be you know, CPUs steal work from one another, which is what you want. If the CPU is available to do work, you want it to go after work that needs to be done that's in queued in a CPU on a CPU.
Bryan Cantrill:But we had a bug where it would still work up until the last thing to steal because there are a there are for a bunch of like gnarly implementation reasons, it was really tough to steal the last thing in part because you're potentially racing with the CPU itself picks up the next thing to go do. So I've just I've seen these kind of failure modes before where where work does not get stolen properly. And I guess it was just me I guess musing about that was just like the the the magic words to for you to recall particular behavior in Tokyo. So do want to describe that?
Eliza Weisman:Yeah. So Tokyo has this optimization called the LIFO. I pronounce it LIFO. I'm gonna get in trouble for this, l I f o. Right?
Adam Leventhal:You know, I'm pronouncing these The last in first out.
Eliza Weisman:The last in first out slot
Adam Leventhal:There you go.
Eliza Weisman:Which I will be prohibited from spelling out ever again. And the idea of this optimization is it's sort of an optimization to improve performance in these sort of actor systems where there's, like, a lot of message passing between Tokyo tasks. And what it is is when a a task on a given worker thread wakes up a cap another task, right, such as by sending it a message through a channel or something, that task is put in a special slot on the same worker thread, and then it will always be the next task in the queue on that thread until another task is woken. So the idea is that if you send a message to your buddy, you know, and wake him up to then pull that message, he gets to go next before all of the other stuff in the queue. And this kind of improves latency, especially in the case of, like, the last thing that task did was wait to receive a message, you know, and then it maybe just, like, finishes up and dies or finishes and completes and, like, writes out the rest of its bytes or what have you.
Eliza Weisman:And that just makes that happen a little bit more quickly without having that task sit all the way in the end of the queue.
Bryan Cantrill:And we do a we do a very similar optimization in the operating system, Eliza, you might be aware of this for doors. So when you make a door call to a door server, you instead of actually in queuing that thing to run, you you give it your time. You you then just become it effectively. And I which I always thought was kind of clever because like, look, I am making an RPC call. This might be really quick, and then it might be done, and then I can run again.
Bryan Cantrill:So I can why not just like you know, as long as I've got the CPU, like, I I wanna run this thing over here. And it's kind of a similar ish idea where we wanna optimize between this kind of ping pong use case. So there's, like, reason to do this. Like, this is this is not a wholly unreasonable thing to go do, but there's a there's some important asterisks on this behavior.
Eliza Weisman:Yeah. There's one specific thing about this slot is that the way that work stealing works in Tokyo is that you have this queue of tasks that are, like, notified. They're in queue to to run on a worker thread. And the way that work stealing works is the other worker threads, when they are bored and have nothing better to do with their lives, come around and commit crimes by, you know, stealing tasks from that queue. And they don't steal tasks from the LIFO's law.
Eliza Weisman:And Well So that's interesting.
Bryan Cantrill:So what that means is if the thing that we wanna execute, which is going to is gonna process our claim, is in the LIFO slot of a of a thread that is actually executing our compute bound task. It's gonna execute for tens of seconds. That work is not gonna run for tens of seconds, which is sad.
Eliza Weisman:So that's kind of bad.
Bryan Cantrill:That's kind of bad. Yeah. That's kind of bad. Fortunately, it is tunable.
Dave Pacheco:And Oh, by turning by turning it off.
Eliza Weisman:Yeah. You can turn it
Adam Leventhal:off. Yeah. You can tune it all the way down.
Bryan Cantrill:You can tune it all the way down to off. And, Dave, I think that, like, that was a that was a relatively straightforward experiment to run. Right? I think that that was the
Dave Pacheco:Yeah. It did require a rebuild, but at this point, we were on the dev system, so that was pretty easy to do. I can't remember if we did this before or after we figured out why that would be enough to cork the whole thing. Because it was for a while, it was still unclear, like, how does that cause the whole thing to be corked?
Eliza Weisman:If memory serves, we were not sure. Like, we were we were pretty iffy about this, and we also went down John in particular, who's not with us pretty particular, who's not with us tonight, was investigating some other behavior or some code he saw in the works dealing in Tokyo that was weird. Yeah. John is still alive, to clarify. He's just not on the podcast.
Bryan Cantrill:Of course, why would you volunteer that information? That would be now now look. Now it looks really weird. Basically, so John and actually, that was that's an important point, Eliza, because John was kind of exploring the this idea of like, how like, what do we what is the behavior of the system when I've got something that's compute bound and something else needs to run? And he's discovering it's like, oh, this thing there there are some pathologies here.
Eliza Weisman:Yeah. So he noticed some code in the in the work stealing code that where you're calculating the number of tasks to steal from another thread, it does a division. And he noted that that means that if there's a single task to in in the queue of another worker when you were going to steal tasks, you won't steal that one. Similarly to what Brian was saying about in the Lumos kernel, it also will not steal the Singleth is a word now. The only remaining thing to run-in the queue, because then you race with the thing that's actually going to go do it.
Eliza Weisman:And so he was wondering if we might be in a situation where there's only one thing in the queue versus the problem of we have this leafless lock that is where the task that needs to run this.
Adam Leventhal:Right.
Bryan Cantrill:And so he's kind of discovering those issues. And Dave, I'm gonna I'm you have already linked in here, but just I do want your you had your kind of your complete analysis as you're connecting the dots because this is where the either I and I as I recall, like John was you and John were kind of going back and forth on hypotheses about how this behavior could back up the whole system because that was still a slightly open question. And what was the your kind of the the thought there in terms of how these things could could all dog pile?
Dave Pacheco:Yeah. So if you if you were just listening to this, as we've said it so far, it would be, I think, a little surprising that so, like, that we got so unlucky that the task that was sitting in the LIFO slot was so critical to forward progress of the program. Right? Because, like, that could be anything, and there's a zillion other things that we do. And, this problem is so reliably hit.
Dave Pacheco:Like, why would we continue to keep hitting that? But that was not random. And so, in parallel, I think with the state map stuff you were doing that morning, I was also doing, this is when I was using Eliza's probes to keep track of the task ID per thread and combining that with some, with the drop shot probes that we have and saying, Well, okay, so this is the request this is a specific request I'm watching that I have induced that I know took nine seconds, and I have a request ID for it. And I'm going to watch what it's doing, and this is when I was using the PID provider. And we were able to see what it was the task was doing when it woke up right after this task that had just been on CPU for a really long time was doing.
Dave Pacheco:Right? Did that make sense?
Bryan Cantrill:Yeah. Absolutely.
Dave Pacheco:And the the thing it was doing, like, I think I had seen this before and it just hadn't hit me how important this was, but it was doing, like it was calling, like, one function and and it was basically it was a call into CORB to release the database claim. So the way this code is structured, the background task that we're talking about remember I mentioned that it fetched a whole bunch of stuff from the database, which probably took I I don't know. Could could have taken a little while because it was fetching a lot of stuff, And then it released that claim. It actually probably did that a few times because it was making paginated requests through a large number of records in the database. So take a claim, release a claim, take a claim, release a claim.
Dave Pacheco:Finally, release the claim, and then it would go on CPU for a really long time. But that releasing the claim, that drops an object that sends a message over a channel. Something needs to read that message over that channel and then put that connection back into service in the pool. That's fine. That's the thing that wasn't running.
Dave Pacheco:So that claim was never being released. But that, too, isn't obviously enough to cork up the whole process because have again, we have plenty of connections. So the fact that this connection is effectively used for a lot longer than it should have been shouldn't have been that big a deal. And that the problem relates to a different code path in corp that Sean had identified, like when we were first looking at this in colo is like, I don't see how this would be related, but if we got stuck at this point in CORB, we could the whole pool would actually be corked. Because what it what CORB is doing is in this case, we've got five different database back ends, and we're gonna maintain some number of connections to each one.
Dave Pacheco:And so when you go to the core pool and you say, I want a connection to the database, it goes to what's called a slot or sorry, a slot set for each back end and says, do you have any connections? Do you have any connections? Do you have any connections? And it expects each of those to respond promptly. It's sending a message over a channel being like, do you have any connections?
Dave Pacheco:And it's getting a response back that says, yes. I do or no. I don't or whatever. Here's the status of this slut. And it's expecting
Bryan Cantrill:that knocking over the network, not blocking on IO. This should be, like, instant for all these things.
Dave Pacheco:Exactly. And that's the task that wasn't running. And it wasn't running because it was in the LIFO slot. And it was in the LIFO slot because we had just released the connection that was going to trigger that thing to go do something. That that's the whole chain.
Bryan Cantrill:Oof. So the we will be disabling the LIFO slot. Right. That is not an optimization that we we we choose not to have that optimization. At least not while work cannot be stolen out of it.
Bryan Cantrill:It's not necessarily an unreasonable optimization, but the opacity of when this cuts against you makes it really, really tough.
Eliza Weisman:Yeah. And you're not the first to be bitten by this thing. There's actually or like, there's a reason that there's now a knob to turn it off. Yes.
Bryan Cantrill:We should be grateful for that, that someone else had hit this beforehand. That's like, yes.
Adam Leventhal:But not a reason to document in detail how one would infer you were being bitten by it?
Eliza Weisman:Only To be honest?
Bryan Cantrill:It's documented pretty well, honestly. Is it?
Adam Leventhal:Oh,
Bryan Cantrill:good. It is. It's just like it is really hard to know when you need this. And I think this gets into the and I think there's, you know, some reasonable discussion on the issue being like, you know, this is really hard to know when a system is gonna hit this. It's kind of like a like halting problem hard.
Eliza Weisman:So so it does get into this sort of like, I would say ideological debate of like how much compute bound work is acceptable to put on the async worker threads.
Augustus Mayo:Right? Right. Right.
Eliza Weisman:A lot of people have opinions about. And, like, the the misoptimization here is specifically happening when a task on an async an async task on an async worker thread performs a relatively large amount of compute bound work without yielding Right. Which the party line is generally party line from from Tokyo is generally don't do that. And instead, that should be run on a blocking worker thread. And so this this is this is kind of a tricky thing because it it's difficult to know in advance, like, how compute bound is this.
Bryan Cantrill:Well, and, Eliza, I believe that my observation was a bit rated. This is where it did remind me of the async cancellation issue, where to construct an argument that the programmer is wrong here, the kinds of arguments you're gonna construct are gonna look a lot like arguments that defend memory unsafe languages. Yeah. And it and it's the the the reason that we actually it's not about, it's like it's a mistake to kinda go to programmer sophistication or lack thereof as because you it's just it's very hard for even an arbitrarily sophisticated programmer to know that they're not gonna end up in this situation. They're they're not gonna be consuming compute on the computer.
Bryan Cantrill:I mean, it's a computer. It's what it does.
Eliza Weisman:Oh, yeah. Yeah. Absolutely. I mean, this is this is something that overall I find that like the the Tokyo documentation is pretty good and a lot of work has gone into making it pretty good. This is a specific thing that I don't really agree with for that reason.
Eliza Weisman:This specific I think there are cases where it certainly has improved latency for people quite substantially when they know that they are going to be doing, you know, I have to go do some like really heavy MPEG processing or some really heavy cryptography. I'm just gonna go and do that in a dedicated thread. That has, you know, that that's often not a bad idea. But I think the danger is that there's a difference between maybe doing this will improve latency for async work and, like, maybe you want to do that because it it will make things faster and more responsive versus this problem of, like, you can actually block the runtime for a really long amount of time if you forget to do this. Right?
Eliza Weisman:So it's sort of like, it maybe is good advice in some cases, but it's not a defense against like, well, you you were holding it wrong when it goes and behaves badly. Yeah.
Bryan Cantrill:Well, the Go ahead, Dev.
Dave Pacheco:I I I was gonna I'm gonna try to make an argument for the other side of this, which is, like, in this case, we've got 10,000 TLS certificates, and that's taking ten seconds to parse, and that's obviously bad. But what if we had one TLS certificate? Is that too long? If that's too long, what about the JSON objects that we parse in our HTTP handlers? And what about the HTTP parsing?
Dave Pacheco:And the more parts of the system that you're punting out to some other thread pool, now you have to wonder about how do I size that thread pool and how do I balance the number of threads it gets against the threads that I give to the async workers? And it's a much harder problem. And if the problem you're worried about is starving an async worker thread that will no longer be able to run other stuff, that's not really a problem, right? Even this 10,000 certificate thing, like, it's a very nice and easy model for us to say, all the CPUs that we want to give to Nexus, they're all in the async worker pool, and we're going to just run all our compute stuff in there. And that's fine because we have a ton of CPUs.
Dave Pacheco:The problem here was the specific case that what I just said is predicated on the assumption that if there's work to be done and idle workers, then the idle workers will do that work. And that's where this where we got burned here. But it really feels like an exceptional case to me. And like the idea that we should try to proactively identify the stuff that might take a lot of compute time, that it just seems intractable. Mean, this we talk about it as async, but all this stuff is using compute.
Dave Pacheco:That's what it's doing.
Eliza Weisman:You know? Just just to be clear, I think that, like, where that advice is coming from, I think is intended for programs that have a very strongly bimodal distribution kind of by design. Like, you're writing a server that processes a bunch of HTTP requests, and then, you know, occasionally, those HTTP requests cause it to do, like, something that you always know it will be, you know, parsing 10,000 certs and never stopping to do IO in there. And the advice is like, maybe you should just go separate those two things because you have those, like, two sort of halves of your workloads, and you would like to continue serving requests during that time. I think that is being taken way too far to go into this sort of idea of like all compute bound or temporarily compute bound workloads in a program that's doing all kinds of different stuff, you know, should always be punted onto this other thread pool.
Bryan Cantrill:Well, it kinda reminds me of like the arguments for processor sets, where we can take groups of CPUs and we can group them into into processor sets. And those processor sets will only run the work that's bound to that processor set. And super useful if you've got like hard real time work or you've got like you you wanna more statically define the way the system is scheduled, it's great. Like they're a really good tool to have, but the recommendation can't be for everybody to run processor sets because then you run out of processors. Right?
Bryan Cantrill:You Right. You're using the the the resource so inefficiently. And the I mean, Dave, as you're saying, it's like the advantage of async is that you I mean, your use case should be a shining example of why it's a great idea to have a shared thread pool. Because it's like, hey, we've got this async work. It's not very important.
Bryan Cantrill:I mean, in terms of like, one's blocked on it. So we should use this available resource we have in terms of this thread pool provided that we don't have more work to do than we've got threads in the thread pool, which should be great. The so the Eliza, another question that kinda and I mean, we were definitely braced for because we we didn't use Tokyo console for this. But Tokyo console is great and I love the visibility that it gives you. But it it's not necessarily a fit for this problem exactly.
Bryan Cantrill:What's what's kind of your take on Tokyo console? I mean, from my perspective, it's like one of the challenges is just not really geared towards production as far as I can tell, but that I I may this is where I'm I'm kinda out of my depth.
Eliza Weisman:Do I have to go get my lawyer? No.
Bryan Cantrill:No. No. It's fine. No. No.
Bryan Cantrill:We're just we're just sitting down having a conversation. You don't need don't need to make complicated. Don't need to know.
Eliza Weisman:Well One of the biggest problems with Tokyo console is and, yeah, you are correct that it's it's one of these things where, you know, I certainly tried to make its overhead not the worst, but it costs a lot to collect all of this information. And in particular, the reason it costs a lot is because of this problem that we were talking about earlier in these async systems, that it's kind of like a lot of the information that you want is no longer known by the time the task is running.
Bryan Cantrill:Interesting. Want
Eliza Weisman:to know where in the program it came from because that sort of tells you what does this actually represent, this sort of opaque object that the runtime has decided to put on the heap. What code does it actually represent? And it's kind of difficult to determine that unless you know where it came from in the program. And that means you have to sort of proactively collect this information. And this is kind of the same as what you were talking about with speculative tracing.
Eliza Weisman:Right?
Adam Leventhal:Yeah.
Eliza Weisman:It's that genre of problem where, you know, you kinda need to know, like, what's this thing? And you need to collect that information now because you might want it when you're actually trying to debug a problem. And so the console, because of that, does have this sort of problem of you're introducing a bunch of overhead to collect all of this data that 99% of the time in production, you're not actually gonna want. So that's it's hard to avoid that. And there's also you know, it's intrusive instrumentation that has inherently kind of more overhead than something like D Trace, where there's basically nothing happening until the information is actually desired.
Bryan Cantrill:Right. In other words, the disabled probe effect of Tokyo console is non zero. So Yeah. As much we might want it to be as low as possible. Just the reality is that the because the information it gives you is extraordinary, but it does it does require work.
Eliza Weisman:Yeah. And it also would not have caught this specific issue with the LFO slot. However, something I do think is like kind of nice about Tokyo console and then maybe it's like worth considering now is that Tokyo console has a notion of warnings. That it essentially does sort of like runtime linting. So it'll look for patterns in the program.
Eliza Weisman:And this is part of what motivated its development was that Tokyo is sometimes difficult to use correctly. And that there would be a lot of sort of common recurring issues that people would show up with and sort of being like, you know, why is my program slow? And then it just turns out to be sort of something that we've heard a million times.
Bryan Cantrill:And there
Eliza Weisman:was so like one of the features that the console has is it'll tell you it'll just sort of watch for various behaviors and it'll give you little, like, warnings while the program is running. Hey, this might be a problem. This task has been compute bound for a really long time. Or the so that it would have caught that part. Yeah.
Eliza Weisman:Or this task was this the future for this task was very large, and so the runtime had to box it because it would have overflowed its stack other which is, like, maybe you have, like, a buffer, you know, that you're declaring inside of an async function instead of on the heap, and it's making your future too big. And that makes spawning it slower because you have to mem copy that whole future or, you know, things of this nature. And then it gives you these, like, little warnings that's sort of like, so we don't know that this is a bug in your program. They're like compiler warnings, but it's something you might wanna take a look at. And so a lot of the time, the guidance that we would give people with this is, you know, don't run it in production, but instead run your software in development and look at it with the console and see what it flags.
Eliza Weisman:And so it probably could flag issues where something has been you know, because it has the with with additional instrumentation of the runtime itself, it could flag things like, hey, a task has been sitting in the LIFO slot for a really long time Yeah. Right. Suggesting that you are running, like, substantially compute bound work on the same worker thread and you're having issues like this. But it wouldn't have helped us debugging this problem because it would have had
Bryan Cantrill:to be there. Right. Right. Right. Right.
Bryan Cantrill:When this is what I think it just highlights the fact that it's a great tool, but it's a different It's a tool with a different use case, which is an important use case, but great for that kind of development use case. But when it went on these production systems and when the async elements become misbehave, we really need and then, Eliza, obviously, the the Tokyo D Trace crate is awesome. And I think you'd highlighted some other things we might the instrumentation in the Tokyo runtime itself where we can get and I think we've already lurched a big step closer, but we can kind of live that dream of being able to get total visibility into what's executing and what's not executing and why. And being able to correlate that across the system. And I think for us, I mean, Dave, we have and we did verify that we we turned this off.
Bryan Cantrill:We turned off the the the LIFO. You almost had to say LIFO optimization, Eliza. The but the I I suppose I I if you if you honor Svig, I I guess I will say LIFO. We turned off that optimization and we saw the the the behavior that we wanted to see.
Dave Pacheco:Yeah. That's exactly right. And, yeah, that was very compelling. Very compelling data point.
Bryan Cantrill:Right. And that's gonna be the fix for us, least for the moment. Like, that's gonna be something that we're gonna be we will be disabling that for for Omicron.
Dave Pacheco:Yeah.
Bryan Cantrill:And I pointed to your full analysis there, but this was a this this was an Odyssey. You know, we fortunately, Dave, that was shorter than the last Odyssey, the the the like it feels like three quarters of a year Odyssey you were on the last time you were talking about the Debug Odyssey.
Dave Pacheco:Yeah. Was rough.
Bryan Cantrill:With with with cockroach. But it was this one was not dissimilar in that we had this thing that, boy, did you know, the symptoms of this were far removed from the root cause.
Dave Pacheco:Yeah.
Bryan Cantrill:And it it was kind of a complicated chain.
Dave Pacheco:Yeah. Unfortunately, a big difference too is that we have a lot more control over the instrumentation in this system. And we've already made a bunch of changes and plan to make a bunch more changes to make this stuff a lot more instrumentable. You know, something that is hitting me hard the more I think about this is, like, if this had been a threaded system, we would have taken a core file and we would have looked at stacks, and we would have understood the blocking chain at least, like, in a minute, I think. We wouldn't have understood the delay slot mean, the LIFO slot problem yet, I don't think.
Dave Pacheco:But we would know what tasks were blocked on what. We spent so much of this time on that. Yeah. We were trying to figure it out dynamically. And we've added a bunch of probes, but I think there's still some probes we'd like to add to be able to like, if there Eliza, is there there's no Tokyo hook yet for task wake up.
Dave Pacheco:Right? Like, task a woke up, task b.
Eliza Weisman:But that be a big one. Really nice to have.
Bryan Cantrill:Yeah. That'd be awesome.
Eliza Weisman:That's something that there actually is a tracing event that the Tokyo console uses. And so if there was a way to glue that into d trace or to add a hook for that so that we could emit a d trace probe in wake ups, that would be really nice. Yeah. Yeah. But I'm one of the others.
Eliza Weisman:The wake ups are supposed to be, like, few instructions, and sticking sticking a bunch of code in that path is gonna have some overhead. And actually, I think ideally, we would just have a USDT eight probe in the runtime. Yeah.
Bryan Cantrill:Right. Right. Right.
Eliza Weisman:Because it's like, we would really like that to be as minimal as possible. And the other thing I was gonna mention, which I see there's a question about in chat, is, yeah, this wouldn't have happened in a threaded program because threaded programs have preemptive multitasking, Right? And this is like a problem that this is specifically like why you might want to have preemptive multitasking.
Bryan Cantrill:Oh, yeah. But as I haste to point out, we have had problems in the past that we did fix that looked a lot like this. And so I think you can also argue that like, well, this is just kind of the the this is part of the the maturation of a system is is getting to not just these issues, but being able to to get the the kind of the surrounding infrastructure to be able to debug them. So it's not hugely surprising that that we hit something like this. But I thought it was great that we were able to Eliza, that you're able to turn around so quickly with the Tokyo D Trace crate was amazing.
Bryan Cantrill:And Dave, that you were able to deploy it quickly. We were able to I just feel like we were able to very quickly get to the bottom of the bottom of this, which was really terrific.
Dave Pacheco:Yeah. Once we once we've reproduced it with those Tokyo probes, I think that was incredibly valuable for that. Yeah. That that was really helpful. Another thing that I was thinking coming out of this is something like task microstates, similar to the way we have thread microstates.
Dave Pacheco:If we'd had that so the Tokyo wake up task wake up probe I was describing would help like a core file, would allow us to understand the parts of the blocking chain that weren't the LIFO delay the LIFO slot, where the HTTP request was blocked on a connection, the connection was blocked on some status from this thing, This thing is blocked on, you know, whatever. That would have the last thing I think we would you know, it's hard to reason about what that would look like in a credit system. But with the task wake up probe, we would be able to see those same connections by tracing that and looking at the stack trace, right? But if we had task microstates, we could also look at the state that's like, how much time is this task spending ready to re ready to run but not running? Right?
Dave Pacheco:There's a there's a thread microstate for that. I forget what it's called. Wait or LAT. It's it's the LAT microstate. Right?
Bryan Cantrill:Right. Yeah. That would have
Dave Pacheco:been a smoking gun. Like this thing is ready to run and has been ready to run for nine seconds and is not running.
Eliza Weisman:That's something that we have in Tokyo console. And I think it's something we probably could figure out a way to get in DTRACE instrumentation as well.
Bryan Cantrill:That'd be great. That that would be huge. That'd huge. I mean, I think and we we made the system better in a couple of different dimensions here, which is exciting. So we that this this is a good one.
Bryan Cantrill:This is definitely had the village in on this one. And Augustus, thank you very much for I mean, you you were definitely the first on scene here. And as you've done so many times before, thank you for all of your hard work. And and, you know, we had a lot of folks involved, John and Sean, and obviously Dave, you and Eliza. And and it was this was a good, you know we always we always come together for debugging.
Bryan Cantrill:It's always great.
Eliza Weisman:Yeah. Dave and I were talking about this on Matrix earlier today, and we discovered that we both share a favorite movie, one of our favorite movies, Apollo 13. And the way that we debug these bugs at Oxide often makes me think of Apollo thirteen, because there's this sort of culture at NASA of the flight controllers in mission control, and then they have this sort of backroom that's full of all of the engineers who design these various systems, and they can kind of pull those guys in for advice and get sort of the domain expert on like this particular part of the spacecraft or whatever. And sometimes the way that we solve problems at OXO is a lot like.
Bryan Cantrill:No, I know what you mean in terms of like being able to quickly pull in all the domain experts. And then it is really Ed Dave, you were I know drawing the analogy to years and years ago when you, Ryan, Doll, and I were looking at a misbehaving node process. And the three of us had no idea what was going on. And when we ultimately root caused it, we just realized like, boy, do we need better interpretation here? Because we had the the person who wrote node, the person who wrote dtrace, or one of the people wrote dtrace, and then the person who wrote the code that we were trying to debug, and the three of us couldn't debug it.
Bryan Cantrill:It's like, okay, we we obviously need we need better instrumentation here, what have you. But Eliza, that's a very good point in terms of like the ability to pull in everybody very quickly, which I'd like to say. And you know, let's let's go ahead and ring the chime one last time for the RTO or episode, which Adam, I've been linking to, like, a decent amount actually because I I feel like this is one of these great strengths of a remote team is that you've got an issue like this. And all of a sudden, you know, you've got a Meet and you've got a Google Meet and you've got all the experts are like right there. You just kinda conjure them out of thin air, and everybody is is beginning to iterate quickly on on hypotheses and and questions we wanna ask of the system.
Bryan Cantrill:It was good stuff. And we we definitely knew I mean, when we nailed this on Friday, I'm like, oh, and we've got a podcast episode for Monday. This is we we what? We've done it again, folks. We have generated the content that we all know that the the that the computer company is really just a ruse for generating content, and we did it again.
Bryan Cantrill:So great work. And yeah, Adam, sorry. Didn't even flip this one past you. I knew we
Eliza Weisman:were No.
Bryan Cantrill:I definitely No.
Adam Leventhal:I saw this one coming. Yeah.
Bryan Cantrill:You say you're like, well, another week. Well, I'll I'll tell that I I I keep calling Morris Chang in for the the the speculation bug episode, and it keeps not happening. Yeah. But next time, Morris. Next time.
Bryan Cantrill:Alright. Thanks everyone. And thanks again, Augusta, Stabe, and Eliza for joining us. Thanks everyone. Talk to you next time.
Creators and Guests